


null
USD
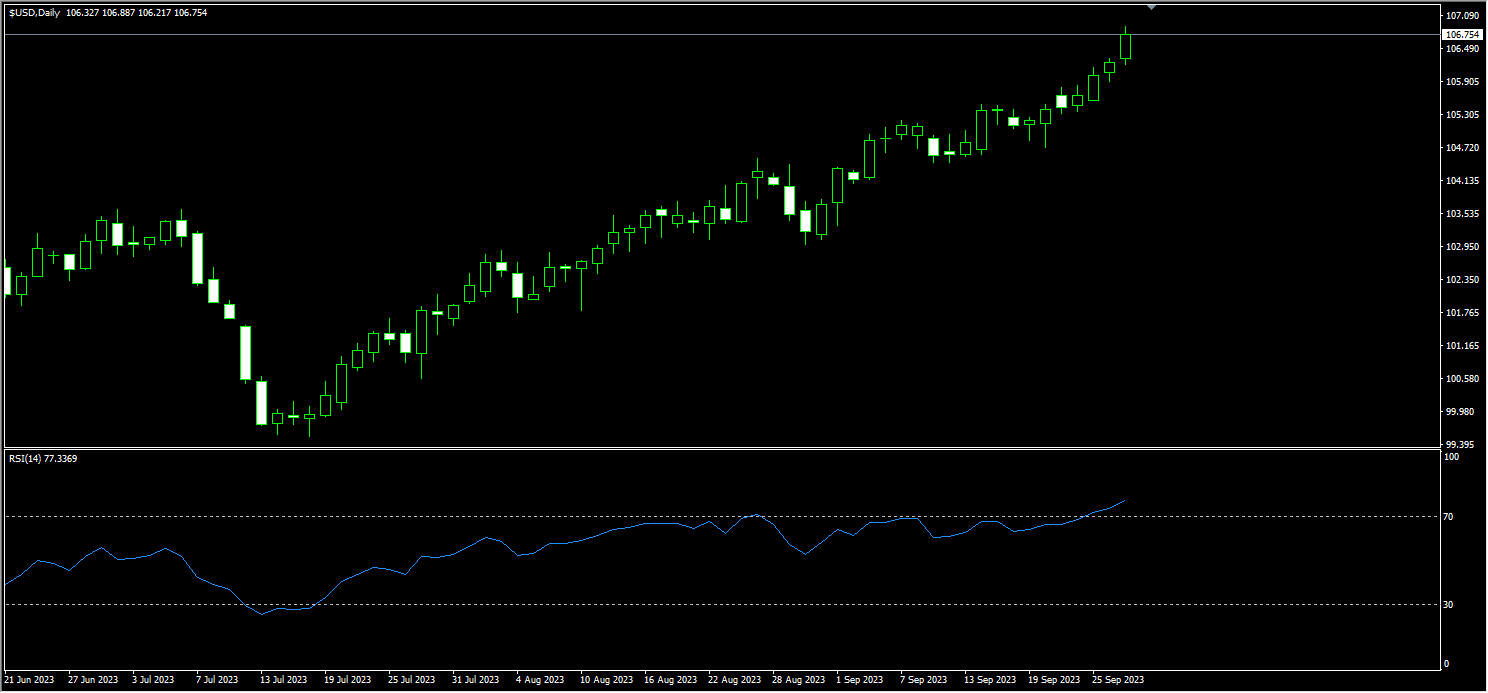
On Wednesday, September 27th, the United States announced a 0.2% increase in durable goods orders, well above expectations and the previous figure, further highlighting the resilience of the U.S. economy. Buoyed by this data, the Dollar Index surged to a 10-month high of 106.83. Following the Federal Reserve's interest rate decision, hawkish comments from officials continued to impact the markets, with even dovish Fed Governor Bauman and Boston Fed President Collins supporting further rate hikes. This continued to stimulate the strength of the U.S. dollar, with the Dollar Index reaching a peak of 106.30, a new high since December of the previous year. At this stage, the Federal Reserve is unlikely to change its stance easily unless economic data collectively weakens suddenly. However, it is challenging for the U.S. economy to remain healthy in a high-interest-rate environment, as it does not align with conventional economic logic. Additionally, if the U.S. government does indeed shut down, it could drag down consumer spending and lead to the Fed cutting interest rates earlier than expected. Currently, the future direction of the U.S. dollar will face more uncertainty. On the surface, the current hawkish attitude of the Federal Reserve is expected to provide continuous support for the U.S. dollar, but potential bearish factors for the U.S. dollar must also be guarded against. From a technical perspective, there are features that are similar to the above points – it looks like there is room for further growth, but there is strong corrective pressure.
From a technical perspective, as long as the Dollar Index remains above the recent support levels of 105.07 (near the midpoint of the Bollinger Bands) and the 10-day moving average of 105.57, the overall bullish pattern remains unchanged. The next targets for the bulls could be around 106.80, 107.20, and 107.99 (last November's high). However, the current technical indicator RSI (Relative Strength Index) is in the overbought zone (77.46), indicating a significant correction risk in the market. Investors need to pay attention to corrective signals from the above-mentioned indicators. If the bearish factors mentioned above materialize, the price may face a significant retracement. On the downside, important support levels to watch include the previous high in March at 105.88 and the midpoint of the recent uptrend channel (currently positioned near 105.07). If these supports are broken on the downside, more downside risk may be triggered towards the 104.60 level (September 20th low).
Today, it may be considered to go long on the Dollar Index near 106.45, with a stop-loss at 106.20 and targets at 106.85 and 106.95.
WTI Crude Oil
The recent consolidation in oil prices seems to have come to an end as crude oil inventories at the largest storage center in the United States have dropped to their lowest levels since July 2022. This has led to significant gains in crude oil prices, reaching new highs for the year. U.S. WTI crude oil spot prices closed at their highest level since August 2022, ending at $92.78 per barrel, with a gain of 3.14%. WTI crude oil underwent a V-shaped reversal midweek, steadily rising from a two-week low as expectations of supply constraints outweighed concerns about uncertain economic prospects that could dampen demand. WTI crude oil reclaimed the $90 mark. It is reported that Oman and Bahrain plan to expand their refining capacity, consuming more regional crude oil to produce diesel and other fuels for export. This will reduce daily Middle East crude oil exports by over 300,000 barrels, further tightening global oil supply. As European and American stock markets continue to decline, market risk sentiment is rising, which will exacerbate concerns among investors about the U.S. economy entering a recession, thereby limiting short-term upward pressure on oil prices. In the short term, there is a possibility of financial factors weighing on oil price adjustments, but with an expected supply shortfall of 3 million barrels per day in the fourth quarter, it is anticipated that there is still room for oil prices to rise further. Currently, the oil market is at a crossroads between bullish and bearish forces, with $100 remaining the medium-term target in the market.
In the short term, WTI crude oil has seen trading battles around the $90 mark in the past two weeks, with four trading days closing below $90, indicating a balanced struggle between bulls and bears. Yesterday, short-term bulls in WTI crude oil showed signs of renewed upward momentum, reaching a recent high of $92.78 per barrel, and it cannot be ruled out that oil prices may enter a consolidation phase at these elevated levels. However, from a medium-term perspective, WTI crude oil has remained above the midpoint of the Bollinger Bands at $88.16 and the 21-day moving average at $87.85 since early September. This indicates a positive medium-term trend, and there may be further upside potential in the future. If WTI crude oil can once again stabilize above the $90 mark, caution should be exercised as it may challenge the recent high of $92.89 and the level of $96.94 (last August's high).
Today, it may be considered to go long on crude oil near $92.40, with a stop-loss at $92.00 and targets at $93.70 and $94.90.

Spot Gold
In the U.S. market on Wednesday, September 27th, due to the rise in the U.S. dollar, the price of gold fell to its lowest level in over six months at $1,972.50, marking a 1.31% intraday decline. This was primarily due to the market preparing for the prospect of long-term high interest rates. Spot gold remained under pressure, falling below the $1,900 level once again, for the first time since August 23rd, and overall displayed a downward trend. Since the Federal Reserve's interest rate meeting last week, more Fed officials have been making hawkish statements regarding monetary rates, pushing the U.S. dollar to its highest level in ten months and exerting downward pressure on gold. Moreover, the Fed's stance on the need for interest rates to remain at high levels for an extended period has weighed heavily on gold, making its price movement challenging. Market participants do not expect a rate cut to occur so quickly unless the U.S. economy "deteriorates" by 2024. More likely, interest rates will remain high, which implies that gold prices may remain under pressure. On the other hand, in the December 13th Fed rate decision, there is a 59.4% chance that rates will remain unchanged, indicating that market participants do not believe there will be further rate hikes in 2023. This could benefit gold as it weakens the U.S. dollar, which could be a positive driver for gold prices.
From a technical standpoint, gold has experienced another wave of declines this week, breaking through all short-term and long-term moving averages, including the 10-day (1918.70), 100-day (1918.10), and 200-day (1927.70) moving averages, indicating a strong downward trend. At the same time, momentum indicators have turned slightly lower, just below the 100 level. The Relative Strength Index (RSI) has steadily declined to around 30, but there are no signs of overselling exhaustion yet. In the short term, the price chart also supports a bearish trend for gold. Gold has significantly fallen below the 200-day moving average, and during the week, it broke through the psychological market level of 1900. Despite RSI being in oversold territory, it continues to trend downward. The initial target is estimated to test the August low of $1,884.90. Once below $1,884.90, gold is likely to continue testing $1,870.20 (76.4% Fibonacci retracement level from $1,804.80 to $2,081.90) and $1,849.30 (50% Fibonacci retracement level from $1,616.80 to $2,081.90). On the contrary, if gold manages to rise above the $1,900-$1,901 level, the next target may be $1,910.60 (61.8% Fibonacci retracement level). Breaking through that level, attention should be paid to $1,917 (Tuesday's high), and the next level to watch is the 200-day moving average at $1,927.70.
Today, it may be considered to short gold before $1,876, with a stop-loss at $1,880 and targets at $1,860 and $1,855.

AUDUSD
The latest release of the Australian Consumer Price Index (CPI) for August showed an increase, causing the AUD/USD to initially rise back above 0.64, reaching a daily high of 0.6410, before retracing below 0.64 to a nine-month low of 0.6330. The data's performance has reinforced the view that interest rates will remain at higher levels for an extended period. Australia's August CPI increased by 5.2% year-on-year, in line with expectations, while June and July CPIs were 5.4% and 4.9%, respectively. Although monthly CPI data tends to fluctuate significantly and may not accurately predict quarterly CPI performance, from the perspective of the Reserve Bank of Australia (RBA), the impact of quarterly CPI is typically more significant. At the same time, risk appetite has taken a backseat due to the surge in U.S. yields (the market increasingly believes that U.S. interest rates will remain high in the long term). Additionally, concerns about the Chinese economy and geopolitical tensions continue to weigh on market sentiment. Despite several support measures implemented by the government in recent months, these measures have yet to trigger a substantial improvement in sentiment.
From a technical chart perspective, the AUD/USD exhausted its upward momentum after reaching the important resistance level of the double top at 0.6521-0.6522 at the end of August and early September. Although the AUD/USD briefly spiked to 0.6511 last week, it lacked follow-through and retraced. Since it has not been able to break through the 0.6521-0.6522 area so far, the path of least resistance for the AUD/USD still leans towards consolidation or a downside bias. This may be due to the lack of upward momentum in the weekly time frame. Currently, attention can be focused on the recent low of 0.6357 (from the pullback low of 0.6521-0.6522). If the Australian dollar effectively breaks below the recent low of 0.6357 (calculated from last week's pullback at 0.6511), a broader downward trend may have formed, opening the door to the lows of November 2022 at 0.6272 and October at 0.6170. Conversely, if the AUD/USD quickly rebounds above 0.6400-0.6410 in the short term, it does not negate the possibility of the exchange rate retesting the resistance levels of 0.6485 (the downward resistance trendline originating from the July high of 0.6895) and the double top pattern at 0.6521-0.6522.
Today, it may be considered to go short on the Australian dollar before 0.6370, with a stop-loss at 0.6395 and targets at 0.6290 and 0.6275.

GBPUSD
GBP/USD has fallen more than 4.5% this month to a six-month low of 1.2110, making it seem like it's on track for its worst month since August 2022. Currently, approximately 71% of retail traders are net long on GBP/USD. Such a majority of retail traders being bullish often suggests a bearish outlook for GBP/USD in the medium term. Moreover, long positions have increased by 3.29% since yesterday and by 12.79% since last week, indicating a stronger bearish sentiment. Presently, the Bank of England (BoE) has maintained a relatively dovish stance, which means that even slight economic setbacks in the UK could be viewed as reasons to pause interest rate hikes. The market believes that the BoE has completed its rate hike cycle. Weak growth, high inflation, and lower real interest rates are all negatively affecting the currency. If upcoming economic data reflects even more negative domestic growth in the UK than the market expects, the pound may face greater pressure.
Looking at recent trends, the pound has fallen for the sixth consecutive trading day, breaking below the 1.2200 level and hitting a six-month low of 1.2110. Currently, the exchange rate is trading slightly above 1.2100. The primary reasons for the relentless decline of the pound are the rising risk aversion in the market and renewed expectations of Fed rate hikes, which are boosting the US dollar index. If GBP/USD were to fall below 1.2120 (the 76.4% Fibonacci retracement level from 1.1804 to 1.3143), the next levels to watch would be 1.2078 (the 38.2% Fibonacci retracement level from 1.0354 to 1.3143), 1.2010 (the March 15th low), and 1.2000 (a psychological market level). On the other hand, from a different perspective, the Relative Strength Index (RSI) has dropped to a severely oversold level (18.98), so caution should be exercised as the exchange rate could rebound significantly toward the 10-day moving average at 1.2266, with the next target being 1.2388 (the Bollinger Bands' midline).
Today, it is suggested to go short on the British pound before 1.2160, with a stop-loss at 1.2190 and targets at 1.2080 and 1.2070.

USDJPY
Despite the statement from Japanese Finance Minister Taro Aso on Tuesday that the government is "closely watching the exchange rate with a sense of urgency," it failed to stem the weakness of the Japanese yen. Midweek, the market brushed aside verbal warnings from the Japanese government, pushing the USD/JPY rate close to the recent high of 149.70. As more Federal Reserve officials support a policy of higher interest rates in the long term, yields on U.S. 10-year and 30-year bonds have reached their respective historical highs. The widening gap between U.S. and Japanese bond yields continues to drive arbitrage trading. The only factor that can potentially halt the yen's depreciation is whether the Bank of Japan (BoJ) will intervene in the market as it did last year. Until intervention occurs, traders are likely to cautiously push the USD/JPY higher. If the exchange rate reaches last year's warning level of 150 without action from the Japanese government, it indicates that this year's warning level may need to be raised. It's worth noting that from a pure technical perspective, signs of a bearish divergence in technical indicators are becoming increasingly evident, so the risk of a significant pullback in USD/JPY should be monitored.
Regarding the technical outlook for USD/JPY, as the exchange rate steadily approaches the 150 level, investors are watching for intervention risk from Japan. USD/JPY saw a midweek oscillation to the upside, breaking through 149.00 and hitting an 11-month high of 149.70. Besides the support from the rise in the U.S. dollar index due to renewed expectations of Fed rate hikes, the significant divergence in monetary policies between the U.S. and Japan continues to support the exchange rate. Additionally, dovish remarks from Bank of Japan Governor Haruhiko Kuroda have played a role in favoring the U.S. dollar. However, technical indicators such as the RSI and Stochastic Index are currently in overbought territory, and the MACD indicator has crossed below the signal line, signaling the need to be cautious about the risk of a USD/JPY retracement. The current support levels to watch are first at 147.82 (Bollinger Bands' midline), followed by 146.01 (Bollinger Bands' lower channel line) and 145.52 (50-day moving average). The current resistance levels are expected to be around 150 (a psychological market level) and 151.94 (last year's October high).
Today, it is suggested to go long on the U.S. dollar before 149.35, with a stop-loss at 148.90 and targets at 150.20 and 150.40.

EURUSD
This week, U.S. economic data continues to be strong, further bolstering the strength of the U.S. dollar exchange rate. Minneapolis Federal Reserve Bank President Neel Kashkari stated on Tuesday that there is a significant probability of a "soft landing" for the U.S. economy, but there is also a 40% chance that the Fed needs to "substantially" raise interest rates to curb inflation. The prospect of a soft landing for the U.S. economy is currently driving the U.S. dollar's continued strength. In contrast, the Eurozone is experiencing the opposite scenario with economic contraction, and interest rates appear to have reached their terminal values. As a result, the euro is struggling to find macroeconomic support at this stage, and under the continued pressure of a strong U.S. dollar, the euro's downward trajectory is likely to continue. The key support level is now at 1.05, and if breached, it could trigger a new wave of declines.
Since reaching a high of 1.1275 in mid-July, the EUR/USD exchange rate has been on a strong downward trend, reaching an eight-month low of 1.0488 yesterday. It remains slightly below the lower channel line of the Bollinger Bands at 1.0535. More importantly, the currency pair is currently in a "death cross" bearish pattern. The key resistance levels for any rebound are the Bollinger Bands' midline at 1.0711 and the descending trendline extending downward since mid-July at 1.0700. The Relative Strength Index (RSI) has dropped below the oversold level of 30 to 24.90. Therefore, as sellers target the recent strength of the U.S. dollar, the currency pair may continue to decline. Targets to watch for include 1.05 (a psychological market level), and if this level is breached, it may pave the way for further declines towards 1.0405 (the 50% Fibonacci retracement level from 0.9535 to 1.1275). On the upside, the first levels of resistance to observe are 1.0600 and 1.0610 (the 38.2% Fibonacci retracement level). If these levels are broken, it may open the door to challenges at 1.0700 and 1.0711.
Today, it is recommended to go short on the euro before 1.0530, with a stop-loss at 1.0560, and targets at 1.0445 and 1.0440.

Disclaimer:
The information contained herein (1) is proprietary to BCR and/or its content providers; (2) may not be copied or distributed; (3) is not warranted to be accurate, complete or timely; and, (4) does not constitute advice or a recommendation by BCR or its content providers in respect of the investment in financial instruments. Neither BCR or its content providers are responsible for any damages or losses arising from any use of this information. Past performance is no guarantee of future results.
More Coverage


Risk Disclosure: Trading Contracts for Difference on margin carries a high level of risk, and may not be suitable for all investors. By trading Contracts for Difference, you could sustain a loss of all your deposited funds. BCR makes no recommendations as to the merits of any financial product referred to on our website, emails, or related material(s). The information contained on our website, emails, or related material(s) does not take into consideration prospective clients' trading objectives, financial situations, or investment needs. Before deciding to trade the Contracts for Difference offered by BCR, please ensure that you have read our Product Disclosure Statement , Financial Services Guide , Target Market Determination , and have sought independent professional financial advice to ensure you fully understand the risk involved before trading.
"BCR" is a registered business name of Bacera Co Pty Ltd, Australian Company Number 130 877 137, Australian Financial Services Licence Number 328794.
The information on this site is not directed at residents of any particular country outside of Australia and is not intended for distribution to, or use by, any person in any country or jurisdiction where such distribution or use would be contrary to local law or regulation.

 English
 简体中文
简体中文
 繁體中文
繁體中文
 Bahasa
Melayu
Bahasa
Melayu
 Tiếng
Việt
Tiếng
Việt
 ไทย
ไทย
 日本語
日本語
 한국어
한국어
 ភាសាខ្មែរ
 español